RECURRENCE INTERVAL
RECURRENCE INTERVAL – In many hydraulic-engineering applications such as those concerned with floods, the probability of occurance of a particular extreme rainfall,
e.g. a 24-h maximum rainfall, will be of importance.
Such information is obtained by the frequency analysis of the point-rainfall data.
The rainfall at a place is a random hydrologic process and the rainfall data at a place when arranged in chronological order constitute a time series.
One of the commonly used data series is the annual series composed of annual values such as annual rainfall.
If the extreme values of a specified event occurring in each year is listed, it also constitutes an annual series.
Thus for example, one may list the maximum 24-h rainfall occurring in a year at a station to prepare an annual series of 24-h maximum rainfall values.
The probability of occurrence of an event in this series is studied by frequency analysis of this annual data series.
A brief description of the terminology and a simple method of predicting the frequency of an event is described in this section and for details the reader is referred to standard works on probability and statistics.
The analysis of annual series, even though described with rainfall as a reference is equally applicable to any other random hydrological process, e.g. stream flow.
First, it is necessary to correctly understand the terminology used in frequency analysis. The probability of occurrence of an event (e.g. rainfall) whose magnitude is equal to or in excess of a specified magnitude X is denoted by P.
The recurrence interval (also known as return period) is defined as T=1/P
This represents the average interval between the occurrence of a rainfall of magnitude equal to or greater than X.
Thus if it is stated that the return period of rainfall of 20cm in 24 his 10 years at a certain station A, it implies that on an average rainfall magnitudes equal to or greater than 20 cm in 24 h occur once in 10 years, i.e. in a long period of say 100 years, 10 such events can be expected.
However, it does not mean that every 10 years one such event is likely, i.e. periodicity is not implied.
Then probability of a rainfall of 20 cm in 24 h occurring in any one year at station A is l/T = 1/10 = 0.1.
If the probability of an event occurring is P, the probability of the event not occurring in a given year is q = ( 1- P).
The binomial distribution can be used to find the probability of occurrence of the event r times in n successive years. Thus
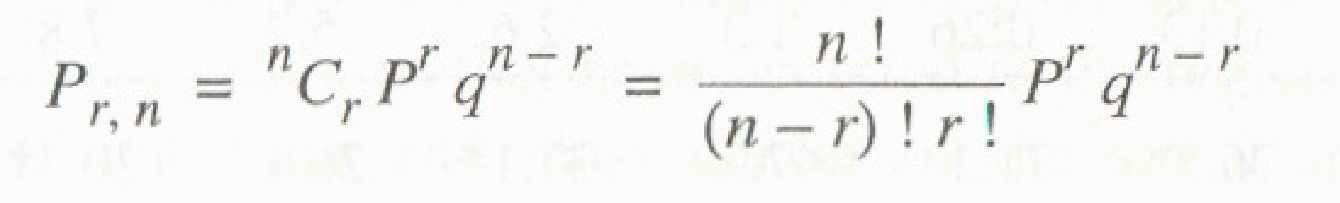
where Pr = probability of a random hydrologic event (rainfall) of given magnitude- and exceedence probability P occurring r times in n successive years. Thus, for example,
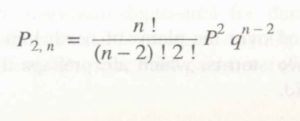
(a) The probability of an event of exceedence probability P occurring 2 times inn successive years is
In using the partial duration series, it is necessary to establish that all events considered are independent.
Hence the partial duration series is adopted mostly for rainfall analysis where the conditions of independency of events are easy to establish its use in flood studies is rather.
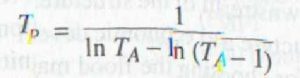
The recurrence interval of an event obtained by 100 series (TA) and by the Partial duration ( Tp) are related by
Other links:
HYDROLOGIC CYCLE
PRECIPITATION
RAIN GAUGE
EVAPORATION
INFILTRATION
GROUNDWATER
Water Table
AQUIFER PROPERTIES
DARCY’S LAW
FLOOD FREQUENCY STUDIES
GUMBEL’S METHOD
FLOOD ROUTING